Budget Forecast and Machine Learning Predictions
Empowering Rail Maintenance Planning: CSX's Need for Efficient Budget Forecasting and Wear Analysis Tool
Overview
CSX Transportation's rail division presented us with a significant challenge: the need for a more efficient method to forecast their rail maintenance budget. Additionally, they sought a sophisticated tool to gain deeper insights into the wear and tear patterns of their rail infrastructure over time. This tool would empower them to proactively plan and allocate resources for their annual maintenance budget, ensuring both cost-effectiveness and, more importantly, the overall safety of their rail operations. Addressing these critical requirements showcases our commitment to providing tailored solutions that not only meet immediate needs but also contribute to the long-term strategic goals and safety standards of our clients, such as CSX.
The Vision
Our approach involves the development and implementation of an advanced forecasting system that optimizes the efficiency of budget projections. Furthermore, we propose the integration of a sophisticated wear analysis tool, offering CSX deeper insights into the evolving conditions of its rail infrastructure. This holistic solution empowers CSX to proactively plan and allocate resources for their annual maintenance budget, fostering both cost-effectiveness and paramount safety standards. By addressing these crucial requirements, our tailored solution not only meets immediate needs but also aligns seamlessly with CSX's long-term strategic objectives, reinforcing our commitment to delivering impactful and forward-thinking solutions.
Problem Statement
The current budget planning process at CSX relies on a cumbersome Excel document prone to version control issues, outdated information, and calculation errors due to multiple users accessing and modifying the file. Additionally, the lack of predictive tools hampers CSX's ability to anticipate rail wear and plan maintenance effectively, leading to inefficiencies and potential safety concerns.
My Responsibilities
In this multifaceted project, I assumed responsibility for every stage, encompassing user research, UI design, project management, and front-end development. Commencing with in-depth customer interviews involving Finance and Maintenance managers, I delved into their perspectives to gain valuable insights. Subsequently, I crafted detailed journey maps, allowing for a thorough comprehension of their existing budget planning process. This holistic approach ensured a comprehensive understanding of user needs and laid the groundwork for subsequent design and development phases.
- User interviews
- Journey mapping
- Card sorting
- User flows
- Ideate and prototype
- User testing/feedback
- Defined timelines and goals
- Set and lead team meetings
Understanding the problem
Following in-depth discussions with our clients, it became evident that their existing method of forecasting future expenses and free cash flow relied on an unstructured Excel document. This approach proved to be inefficient, as the document was disorganized, non-shareable, and prone to issues such as being quickly outdated or containing inaccuracies in the underlying formulas. Recognizing the need for a more robust solution, we collaboratively devised a two-phase approach to address these challenges.
The first phase involved the development and implementation of a sophisticated budget planning tool designed to serve as the definitive source of truth for expense forecasting and cash flow analysis. This tool aimed to streamline the budgeting process, eliminating the pitfalls associated with the Excel document, and providing a centralized and easily accessible platform for collaborative budget planning.
In the second phase, our focus shifted towards creating a digital visualization tool to depict the wear and tear patterns of a rail head over time. This visualization aimed to offer a comprehensive understanding of the rail's condition, empowering our clients to proactively plan maintenance activities. The overarching objective of this dual-phase approach was clear: to reduce maintenance costs significantly and extend the overall lifespan of the rail infrastructure.
By combining a reliable budget planning tool with a digital visualization solution, we sought to enhance our clients' decision-making processes, foster collaboration within their organization, and ultimately contribute to the overarching goal of achieving cost-efficiency and prolonged rail life. This collaborative and strategic approach exemplifies our commitment to delivering comprehensive solutions that address the specific needs and challenges faced by our clients.
User Research and Exploration
In my capacity as a Designer/Developer and Project Manager, I established close collaboration with the Maintenance Manager and a Customer Success Manager to deliver a comprehensive solution. Commencing with a thorough customer interview, I utilized journey mapping to gain insights into the existing workflow within the Excel document. Employing card sorting techniques, I organized inputs efficiently in the UI. Through an iterative process, I presented low-fidelity wireframes to test user hierarchy and flow, ensuring a seamless experience for both first-time users and those comparing different calculations.
Design Decisions
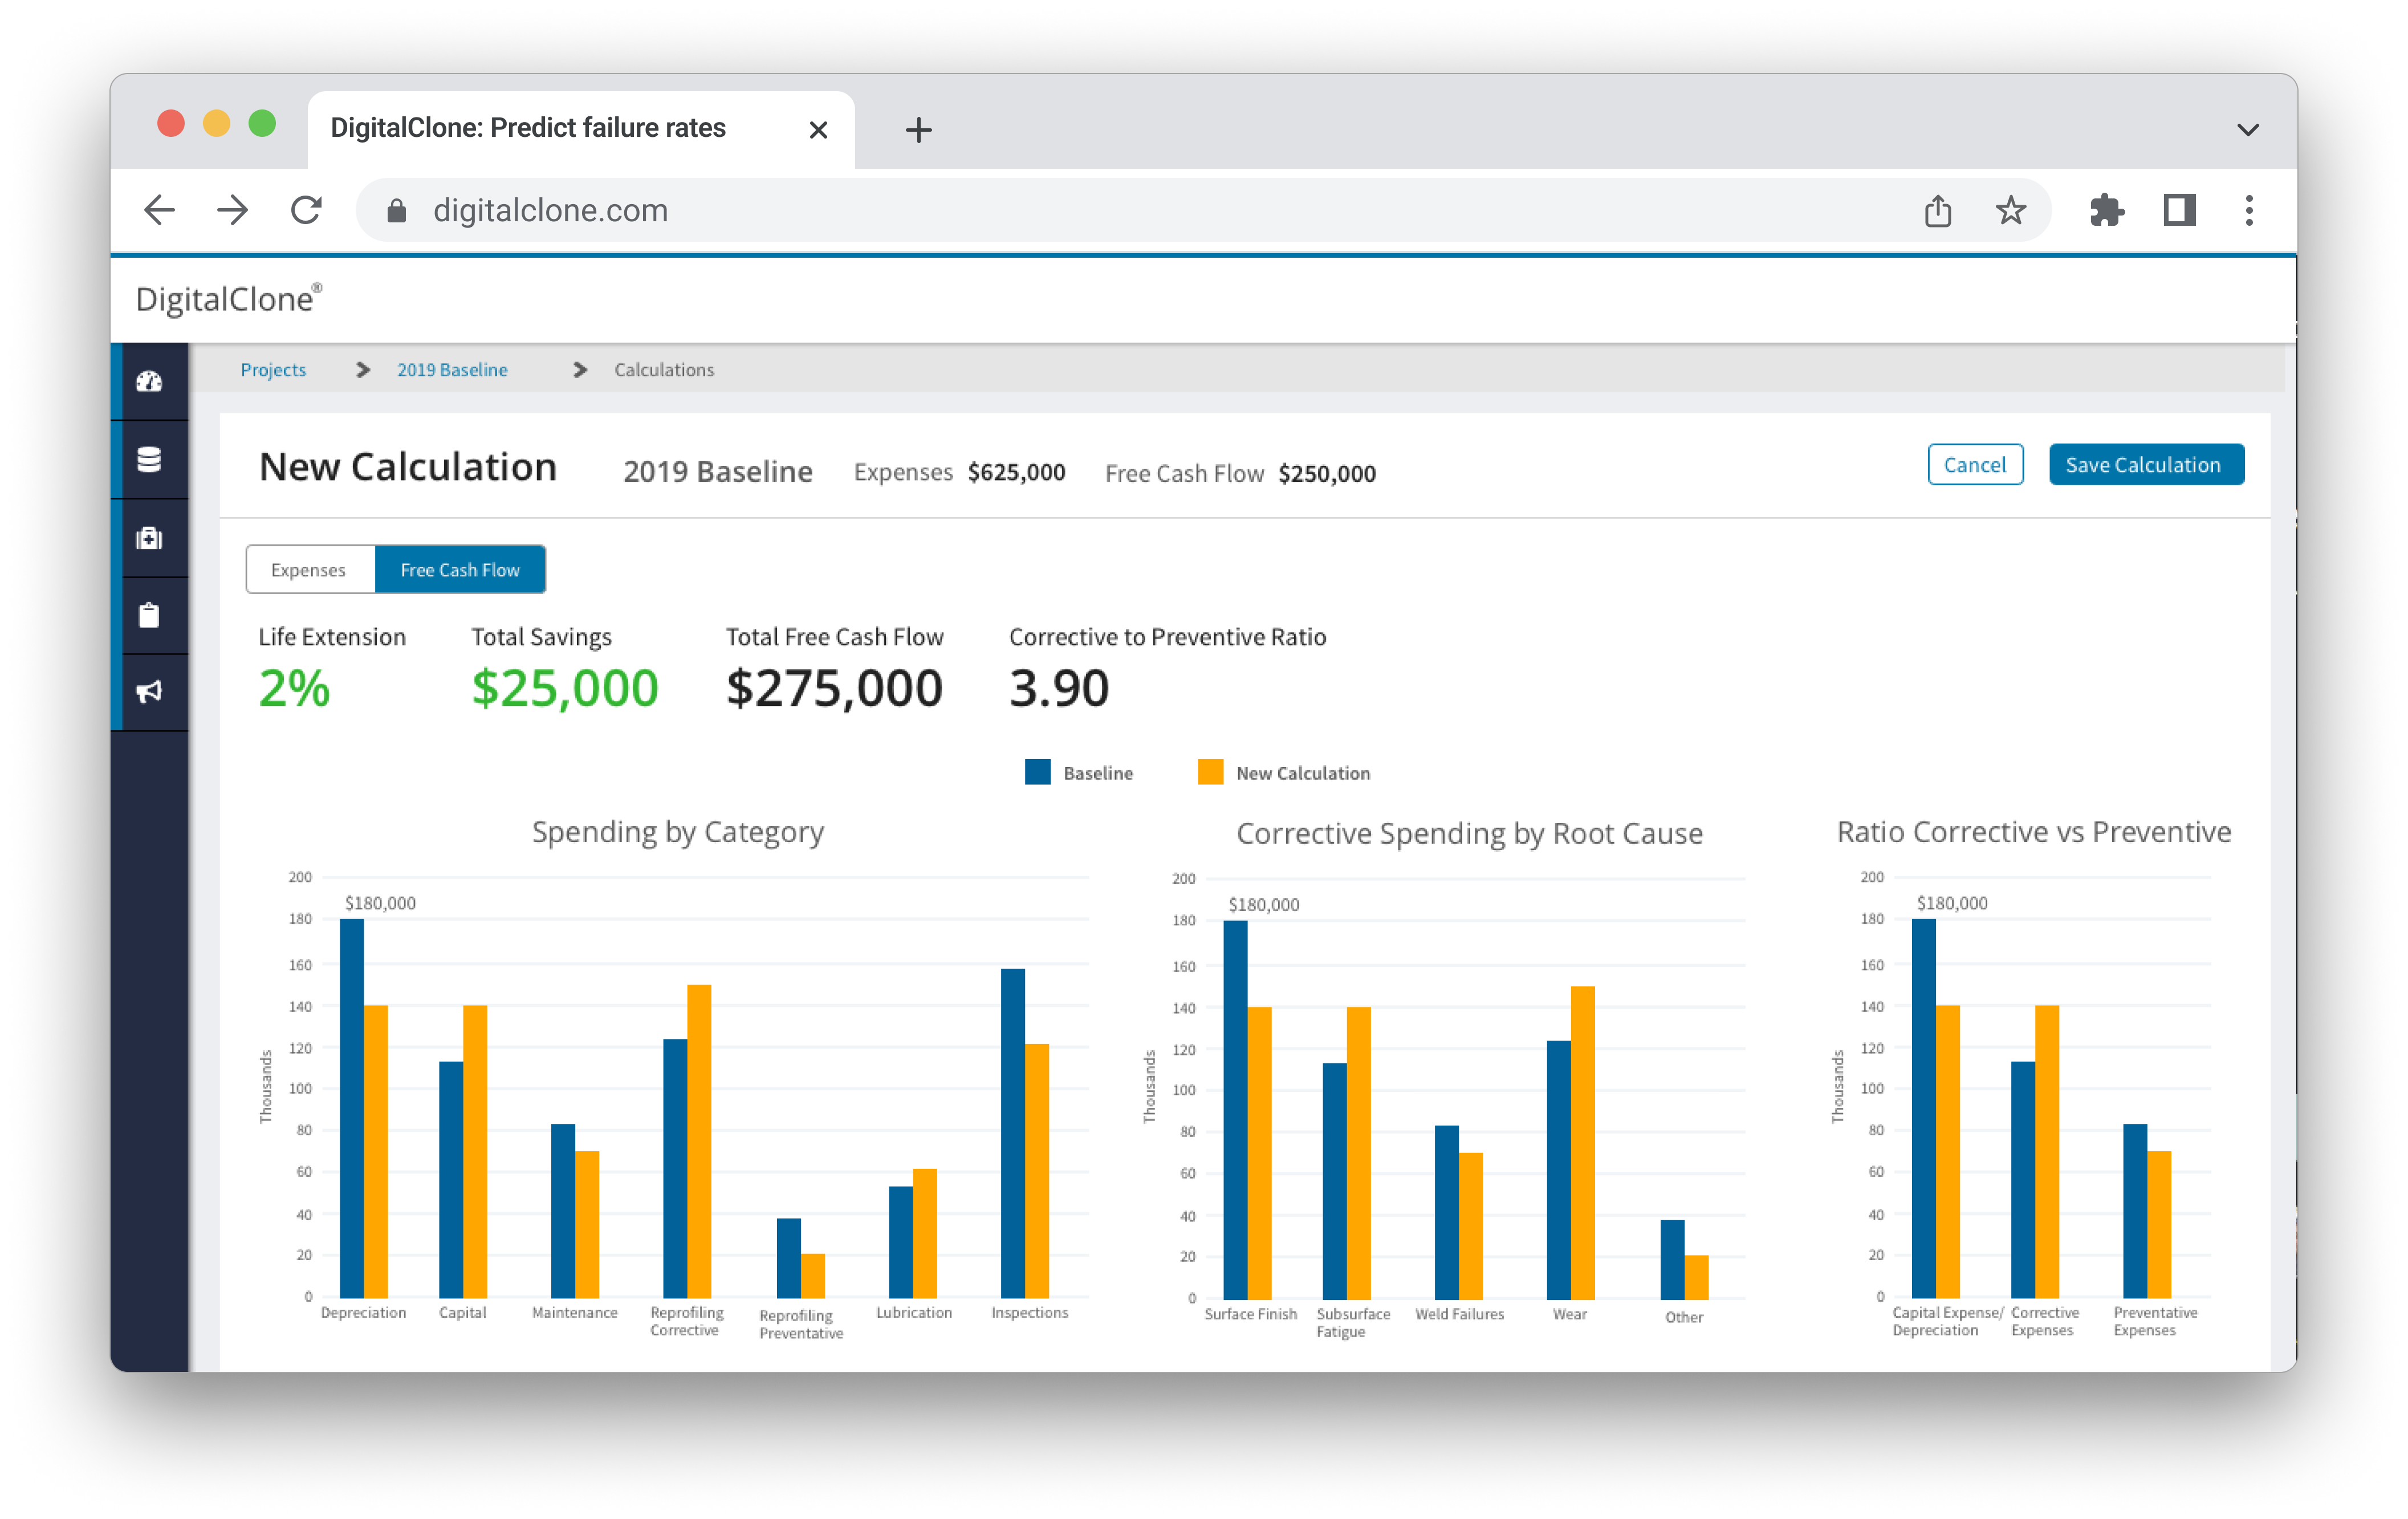
Choosing the right data visualization
One of the pivotal design decisions involved selecting a bar chart as the optimal data visualization method. This decision, informed by insights gained during the comparison phase, aimed to facilitate side-by-side value comparisons efficiently. The project's success was underscored by not only meeting the Maintenance Manager's requirements but also contributing to improved efficiency and user satisfaction. This multifaceted role allowed me to blend design expertise with hands-on project management, resulting in a solution that aligned precisely with the project's goals.
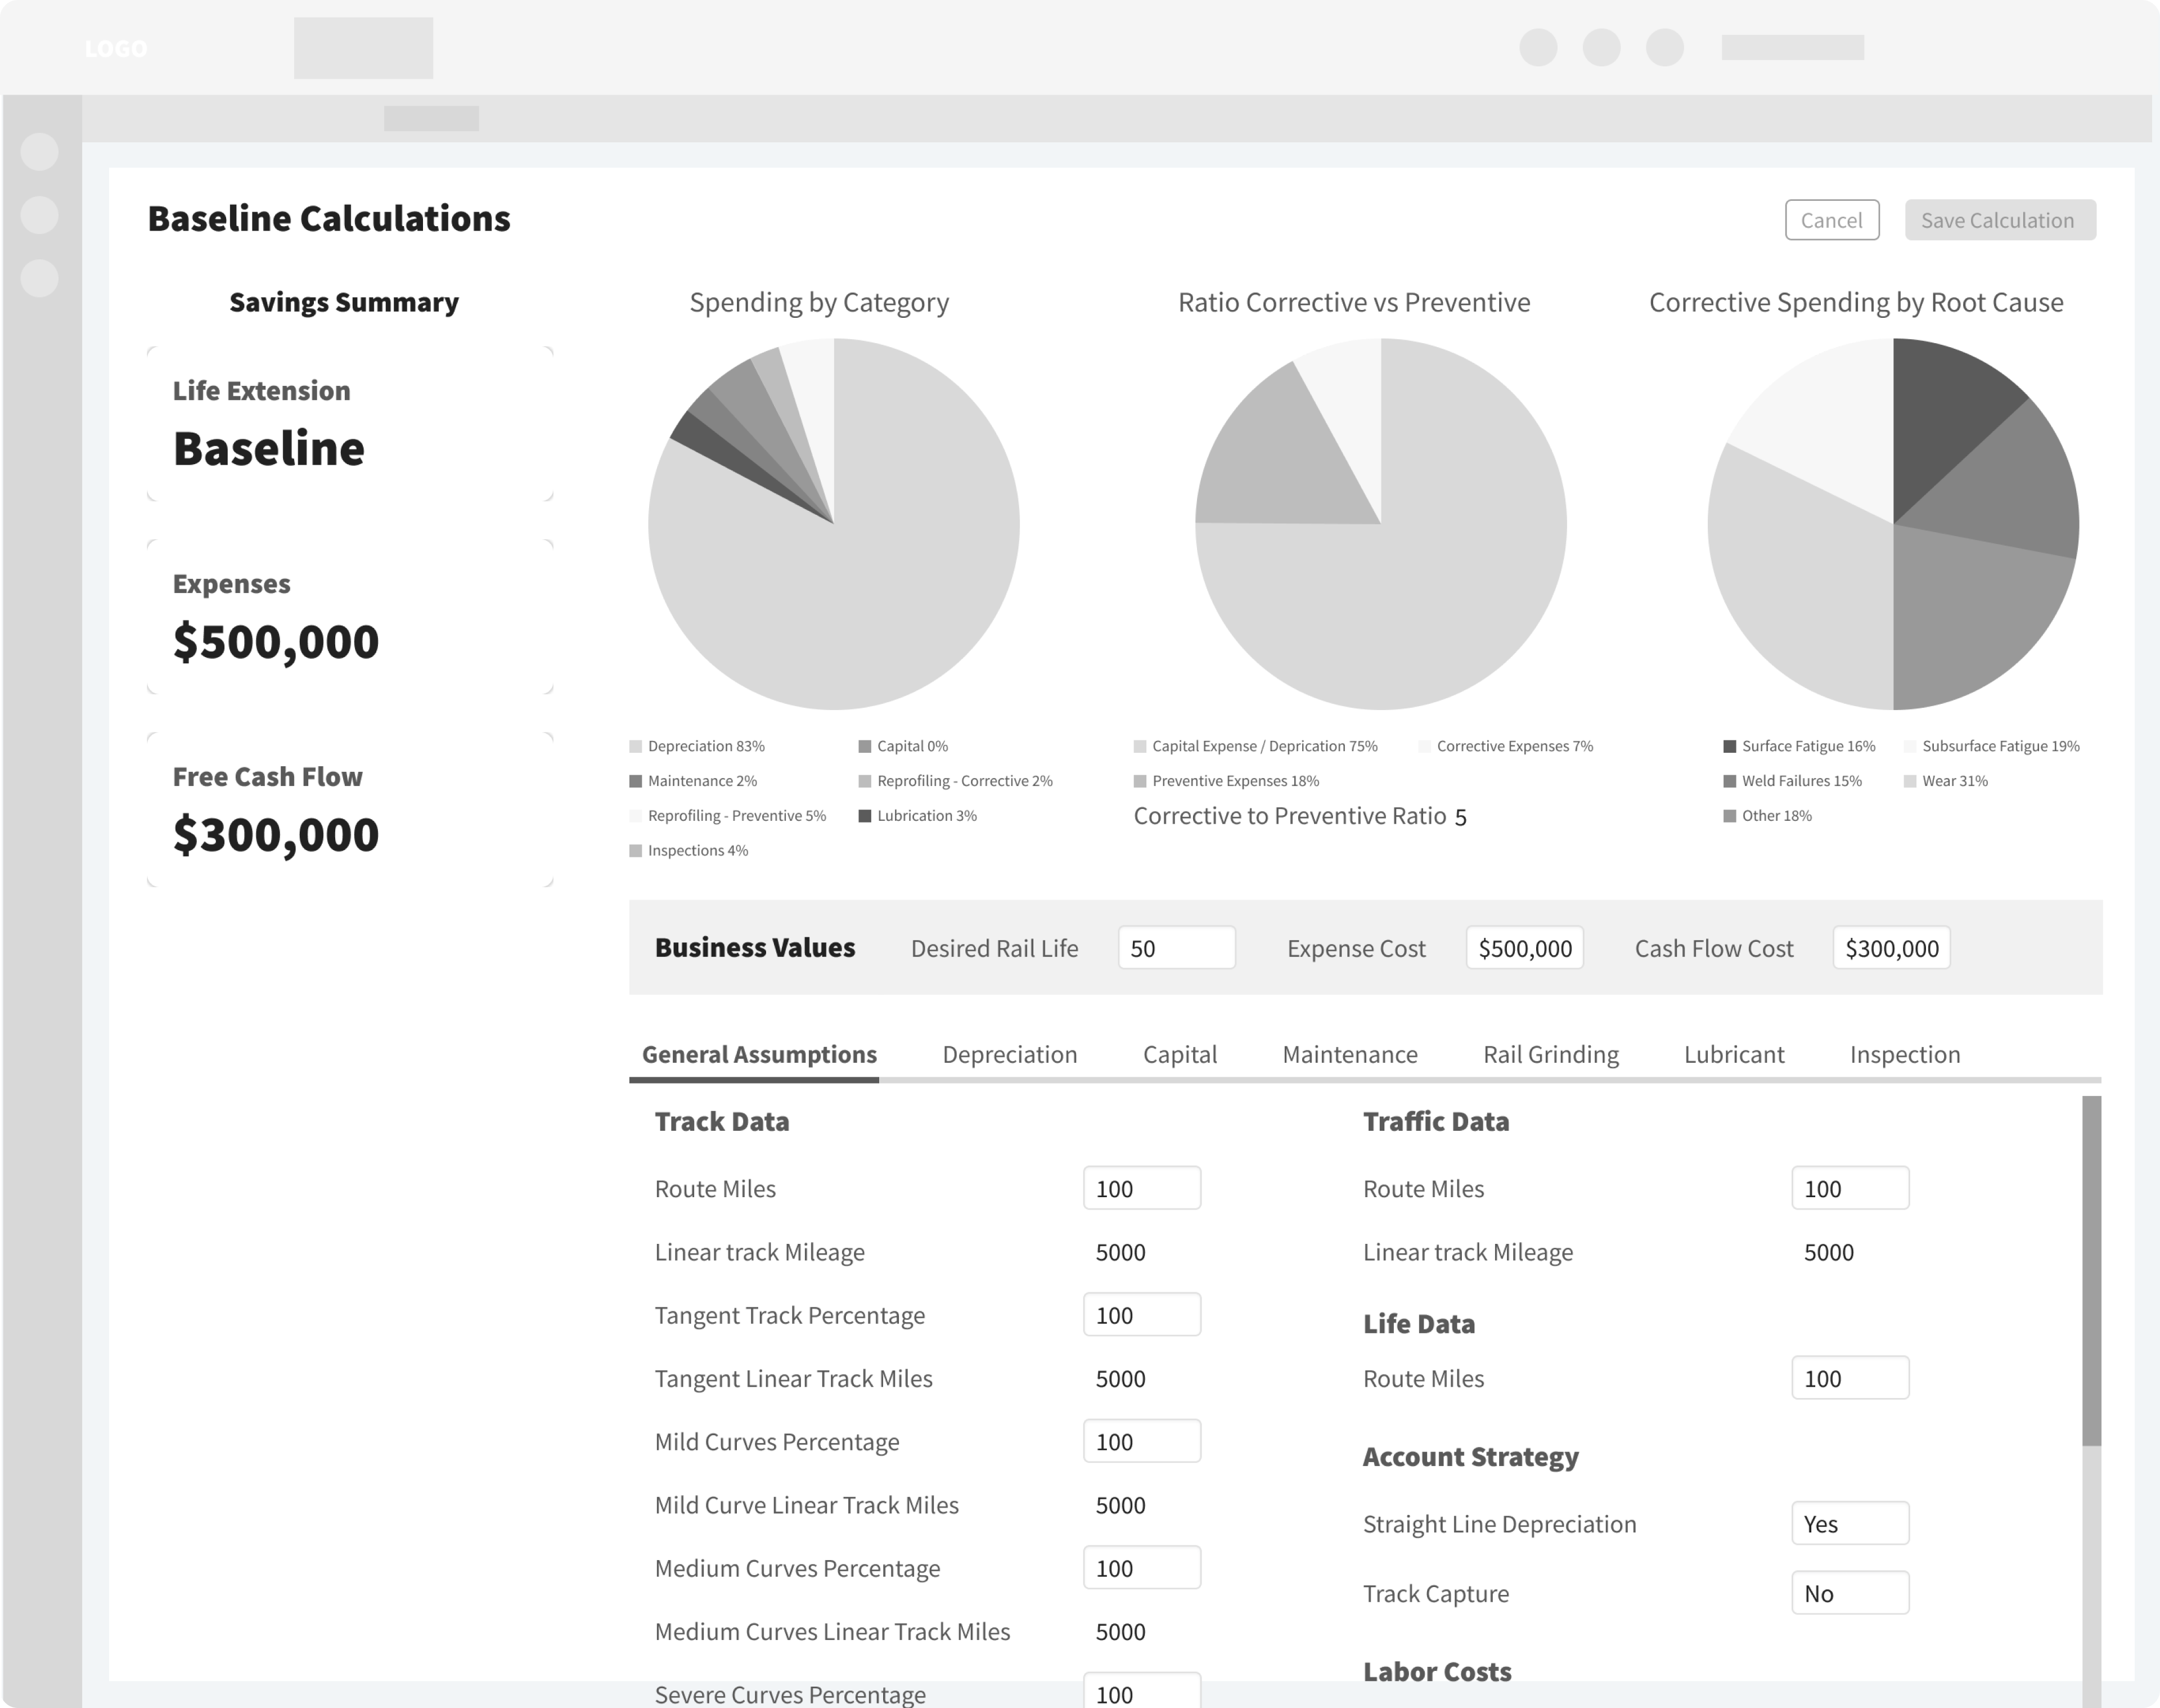
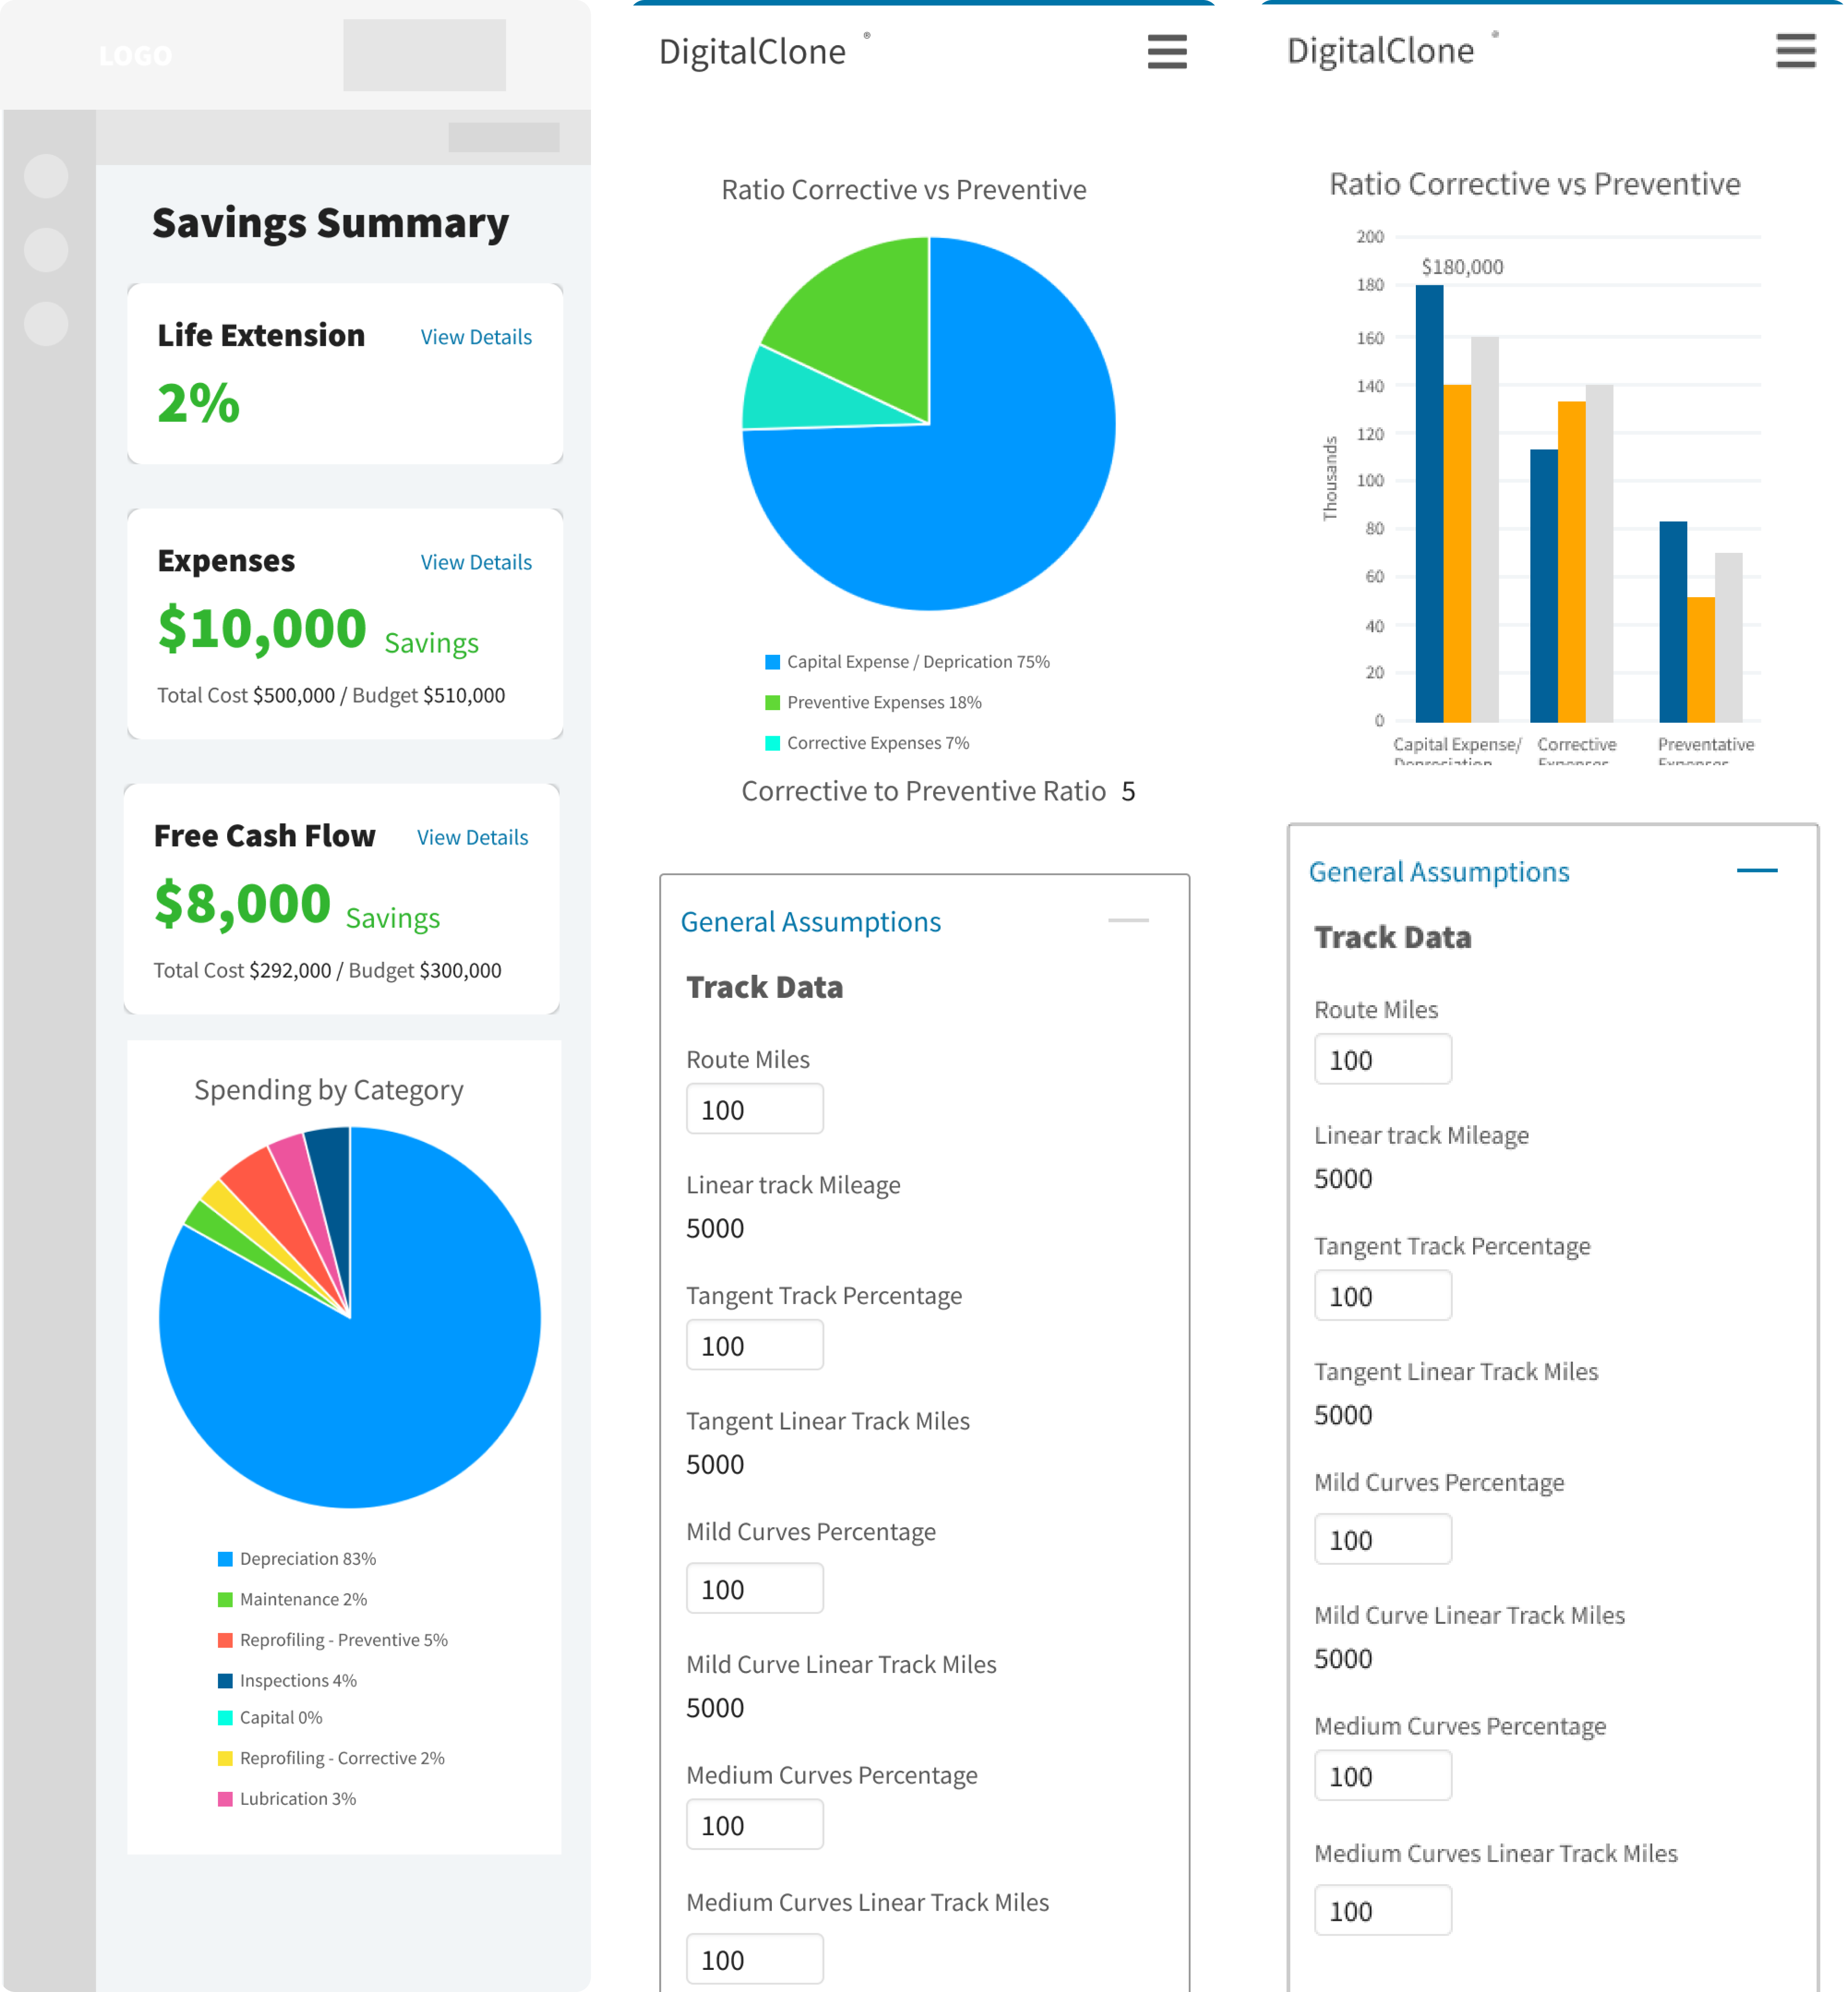
We choose a bar chart over a pie chart for several reasons. Bar charts excel at facilitating comparisons between different categories or groups, as users can easily assess the length of bars to understand relative values. Their clear representation of data simplifies interpretation, ensuring users can grasp information effortlessly. The linear nature of bars allows for precise measurements and comparisons, enhancing the accuracy of data understanding. Additionally, bar charts prove versatile by effectively displaying multiple data sets, particularly when grouped or clustered, making them suitable for presenting complex information in a comprehensible manner. The inherent strengths of bar charts in facilitating comparison, clarity, precision, and versatility make them a preferred choice for visualizing data in various contexts.
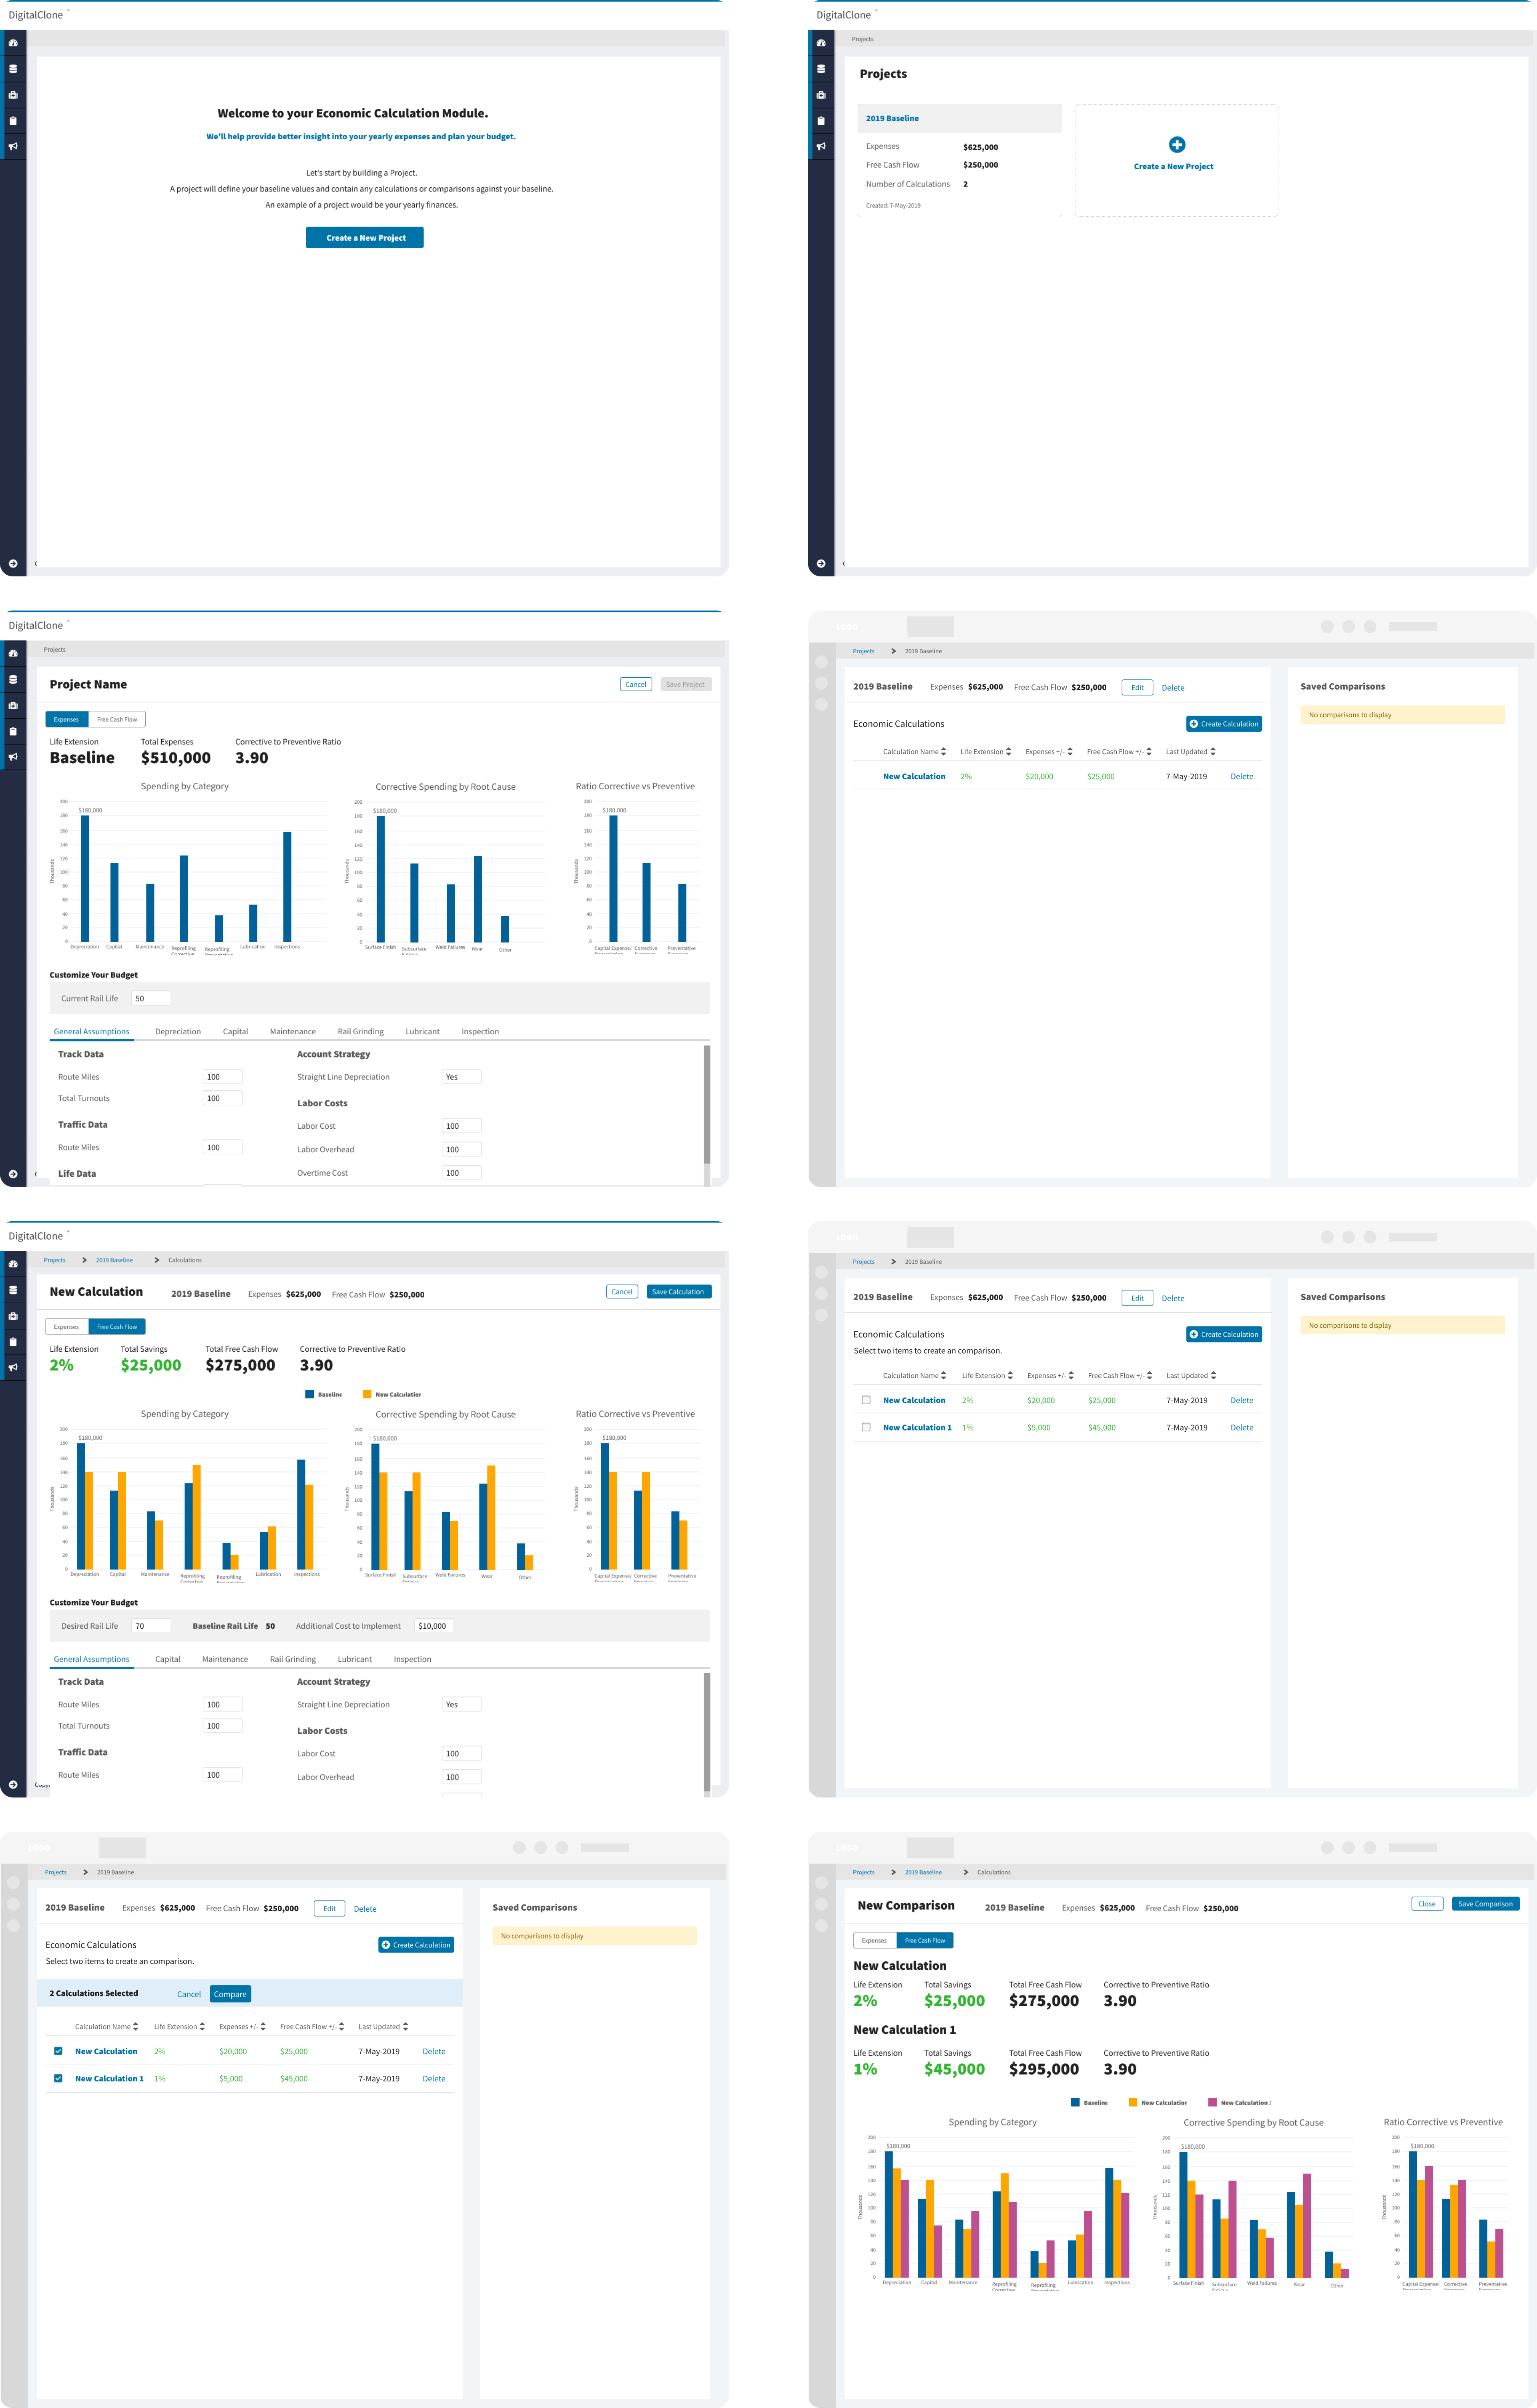
User Flow
A "Project View" is a feature designed to house various calculations or budget options that users can create. Within this view, users have the ability to create multiple calculators to compare values and assess life extension scenarios. This allows for a comprehensive and organized overview of different financial projections or scenarios within a single project, facilitating effective comparison and decision-making.
After initiating the project creation process, users are guided to establish a baseline set of values. This foundational baseline serves as a reference point that users can leverage to create additional calculations for comparative analysis. By having a well-defined starting point, users can systematically generate and assess various scenarios, enabling them to make informed decisions and comparisons within the project framework.
The culmination of the process is the Comparison View, consisting of a baseline model and up to two additional calculations. This comprehensive report serves as a valuable tool for users to share and present to their board, aiding in the decision-making process for their annual maintenance plan. The Comparison View provides a clear and concise overview of different scenarios, facilitating effective communication and informed decision-making based on the calculated data.
Machine Learning Predictions
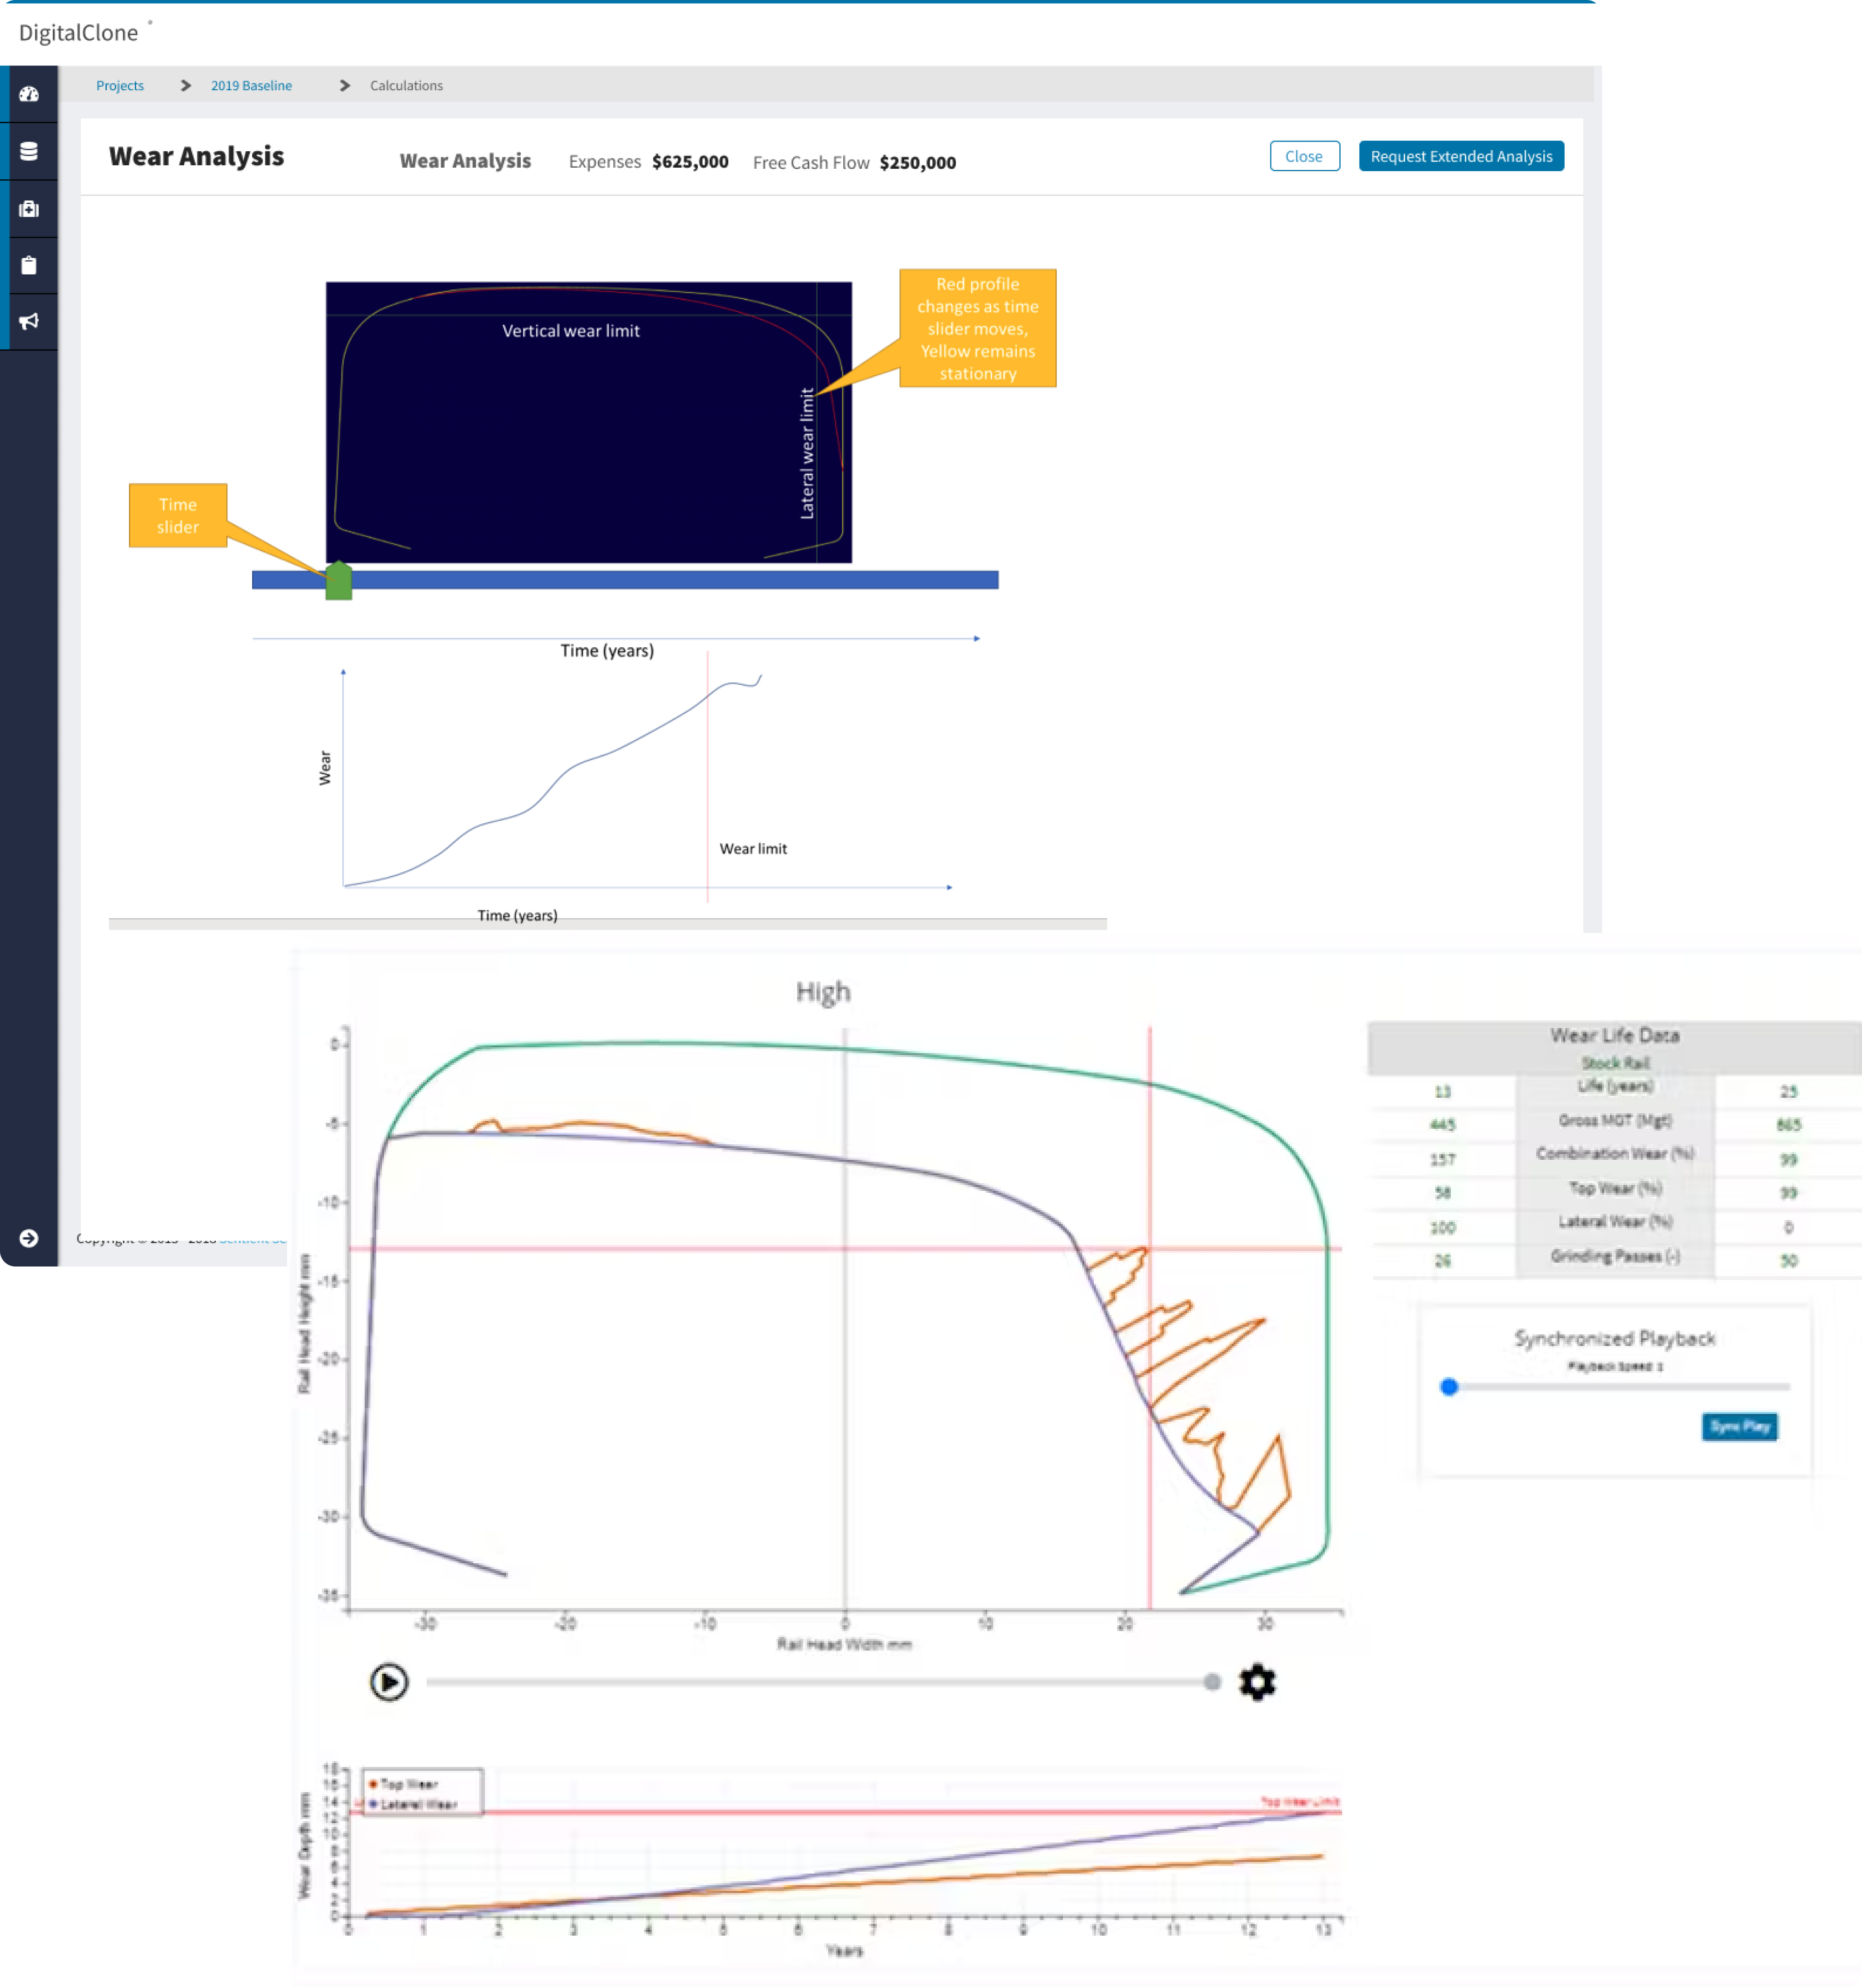
In Phase 2 of the project, we introduced visual charts illustrating rail grinding processes, offering stakeholders, especially engineering teams, a dynamic view of how rail infrastructure wears over time. Complementing this visual representation, we implemented machine learning algorithms to predict and forecast how the rail would wear in the future. This advanced application of machine learning technology became an invaluable addition to the toolset, enhancing the proactive nature of maintenance planning.
The machine learning predictions enabled engineering teams to not only observe current wear patterns but also anticipate future wear, allowing for even more precise planning and resource allocation. This predictive capability empowered teams to take preemptive actions, optimizing preventive maintenance programs and extending the life of the rail infrastructure.
The visual charts, coupled with machine learning predictions, collectively transformed the maintenance planning process. Engineering teams gained a holistic understanding of the rail system's wear dynamics, enabling them to prioritize interventions effectively. Moreover, this approach contributed to the optimization of execution, financial planning, and the overarching goal of ensuring the safety and longevity of rail assets. Our integration of machine learning exemplifies our commitment to leveraging cutting-edge technologies to enhance the efficiency and effectiveness of rail maintenance programs.
Outcomes and Learnings
This product was acquired by a Rail company Loram Technologies. The recent acquisition of Digital Twin for Rail from Sentient Science marks a significant strategic move in the rail industry. The acquisition encompasses Sentient Science's innovative digital twin technology and economic models products, both of which play a pivotal role in revolutionizing rail operations. Digital twin technology involves creating a virtual representation of physical assets, enabling real-time monitoring, analysis, and predictive maintenance.
With this acquisition, Loram Technologies gains access to Sentient Science's cutting-edge digital twin solutions designed specifically for the rail sector. These digital twins are instrumental in providing an accurate and dynamic reflection of the rail infrastructure, allowing for continuous monitoring and assessment of its condition. By leveraging digital twins, railroads can proactively identify potential issues, predict wear patterns, and optimize maintenance practices.
Moreover, the economic models products from Sentient Science contribute to cost-effective decision-making within rail operations. These models enable railroads to extend the life of their tracks strategically and implement maintenance practices that result in substantial savings. The integration of economic modeling enhances Loram Technologies' capabilities in offering comprehensive solutions that not only address immediate maintenance needs but also contribute to long-term financial and operational goals.
Learnings
Reflecting on the project, I recognize that refining the UI for high-level metrics could have contributed to a more intuitive user experience, helping users create a better sense of space and affordance. Given additional time, I would have preferred to conduct further research on color combinations specifically tailored for data visualizations. This would have allowed for a more deliberate and informed selection of colors to enhance clarity and visual impact within the application's data representation.
Overall, this was an amazing experience. Handling all aspects of user research, UI design, project management, and front-end development in this project provided a comprehensive view of the entire process. The fast-paced nature of the project, driven by tight deadlines, presented a challenge that I successfully navigated. Stepping back to review the end result, I feel honored to have contributed to such an important project.